Save Time With Standardised Code
iVIEW Dataflow is a low-code framework for Qlik that helps you save time and money. Everything is configured in a central repository so there is no need to make changes to the code, no need to make multiple updates when conditions change.

Governed ETL Processes
All workflows are structured according to Qlik’s best practices and compatible with an integrative corporate BI strategy. Give your Qlik projects a standardized structure and simplify your deployment process. Comprehensible, easy-to-read ETL logic, also for non-Qlik-developers.

Powerful Workflow Engine
Data integration and dimensional modelling with an intuitive and powerful stack of ETL operations for the BI developer. The generated Qlik code is readable and well documented.

Automated Workflow
Dataflow makes use of Qlik’s own APIs for a controlled, flawless deployment to Qlik Sense . Unify your deployment processes and allow for a continuous delivery in your BI projects.

State-of-the-art Technology
Stand-alone web application which is easily installed in a few clicks.


Dataflow – On Demand
The on-demand model uses the iVIEW Dataflow framework with the wizard to automatically generate user-based applications based on a pre-defined data model.
This can be a powerful tool for organizations that need to build and deploy customer applications quickly & without requiring extensive development resources.
Front-End App on the Go
The direct connection between the Dataflow model and the KPI in the iVIEW Library would allow users to view and analyze KPI data in real-time, without having to manually transfer data between the two systems.
The split screen between the iVIEW dataflow model and the KPI dashboard in the iVIEW Library would enable users to quickly compare and analyze data, making it easier to identify trends and patterns.
Workflow Landscape in Dataflow
A workflow landscape is a visual representation of the various workflows and data dependencies within a system or project.
It shows how different data sources, applications, and processes are connected and interact with each other which helps to identify bottlenecks, redundancies, or potential issues in the system.
It can also help with data lineage and tracking of data movement.
It provides a clear view of where data is coming from and how it is being used.
It will also help identify the different applications involved and how they relate to each other.
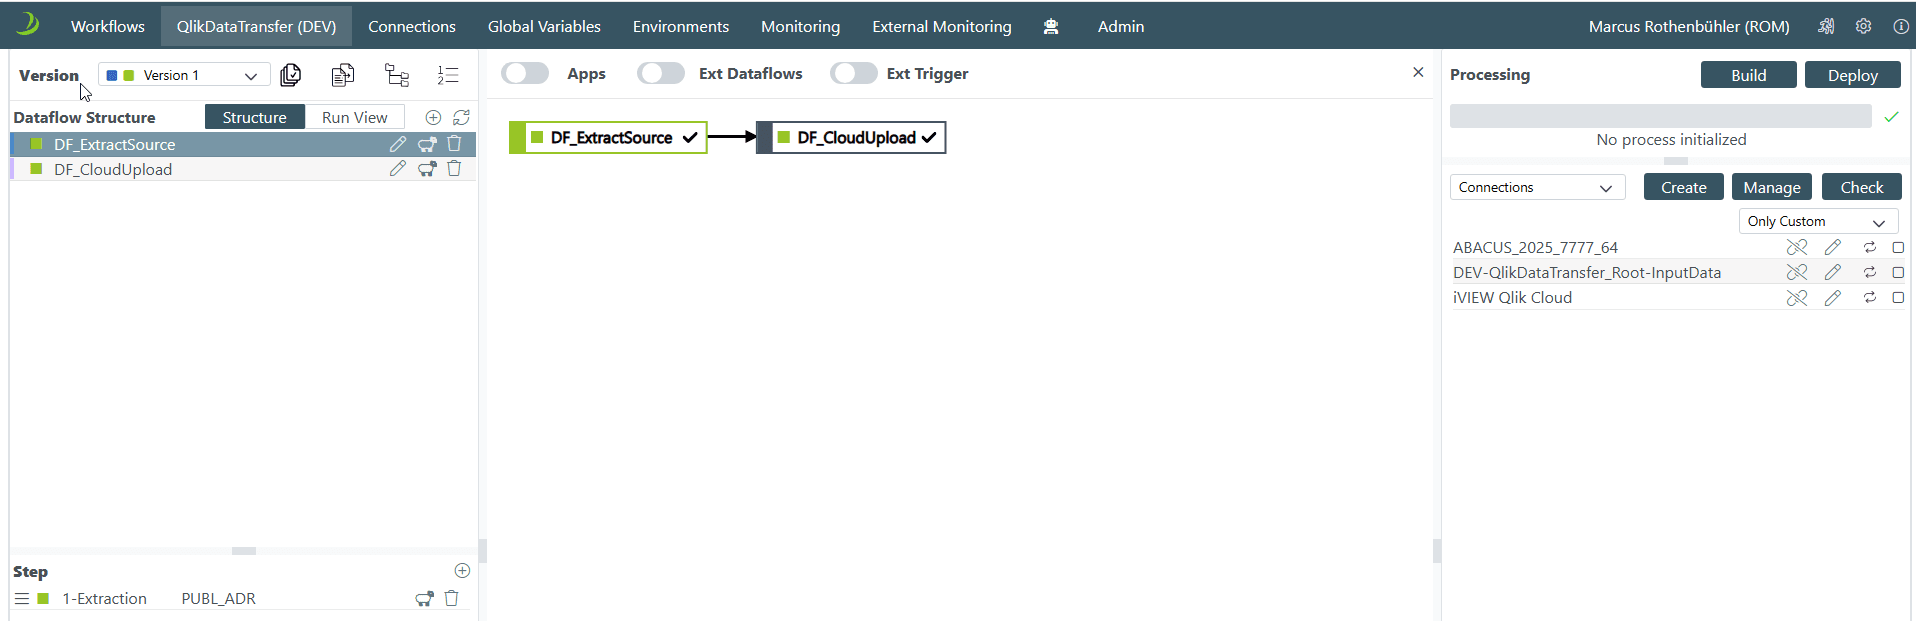
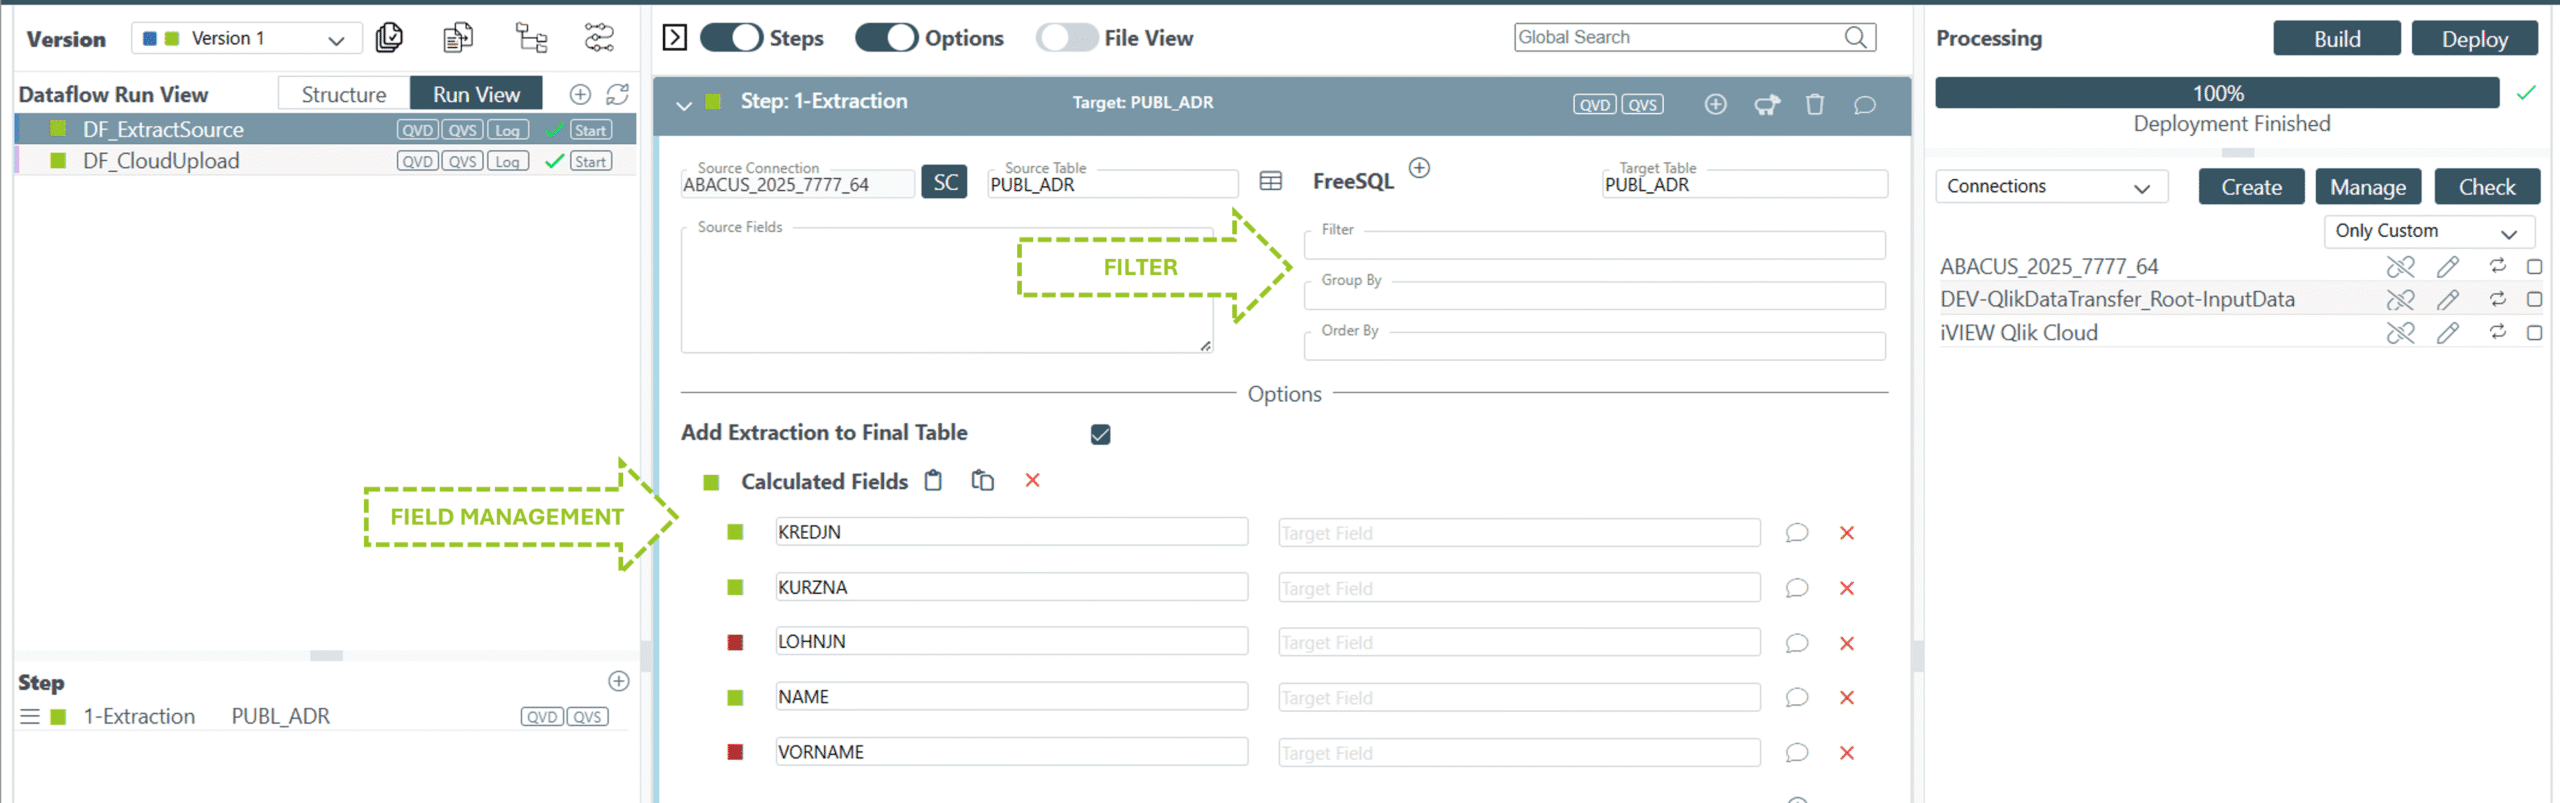
Dataflow can extract data, reduce or transform it before upload. In addition, it provides dedicated functions to filter data and enable or disable fields, ensuring that only the necessary fields and tables are uploaded.
Dataflow orchestrates the transfer of data from the source system to the cloud target.

Dataflow displays details of your cloud capacity package and provides real-time estimates of expected consumption prior to data upload.
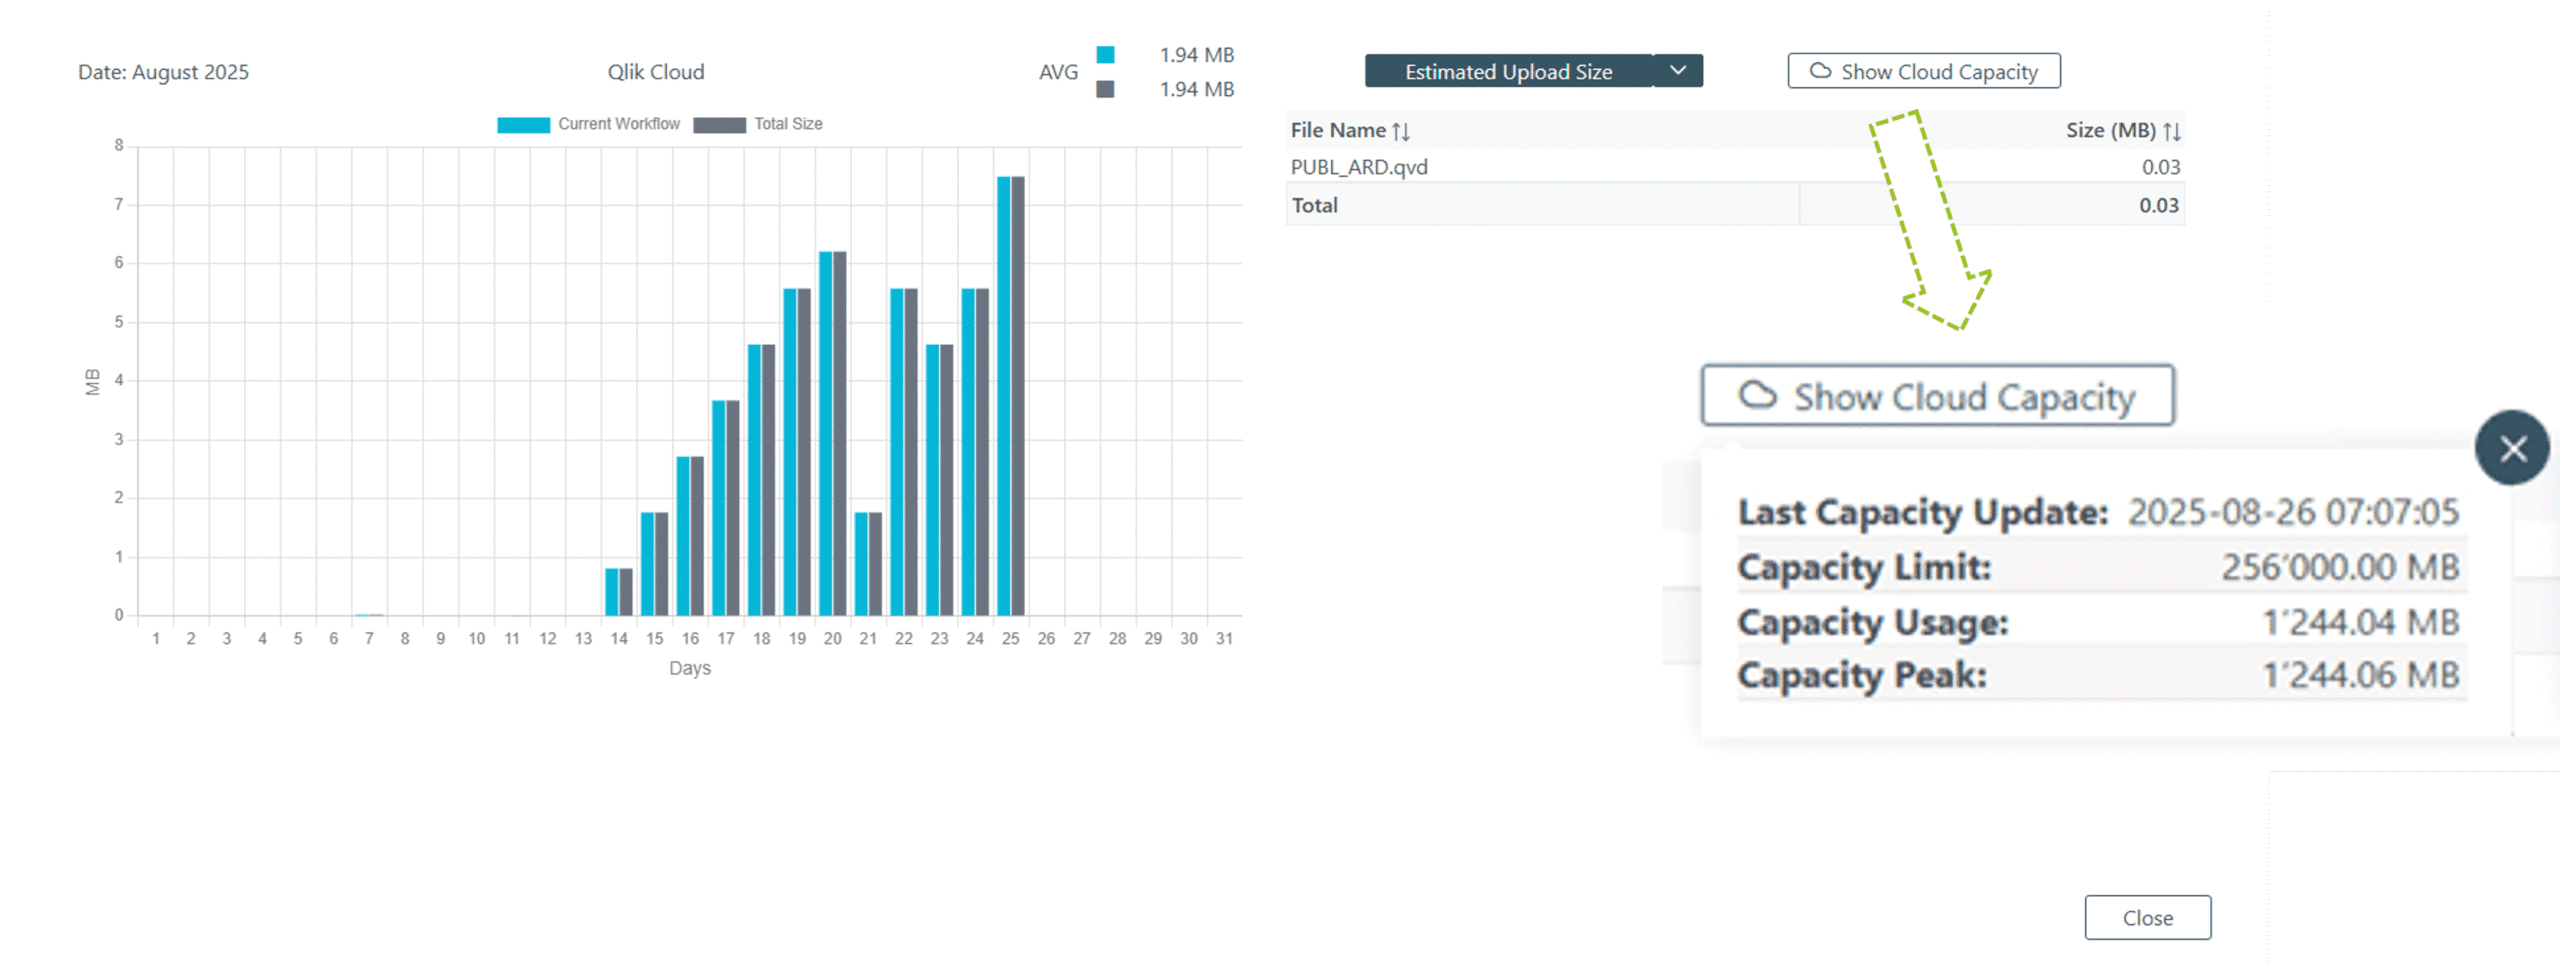
Dataflow provides real-time visibility into used storage compared to your cloud capacity, enabling you to monitor the data process flow end-to-end.
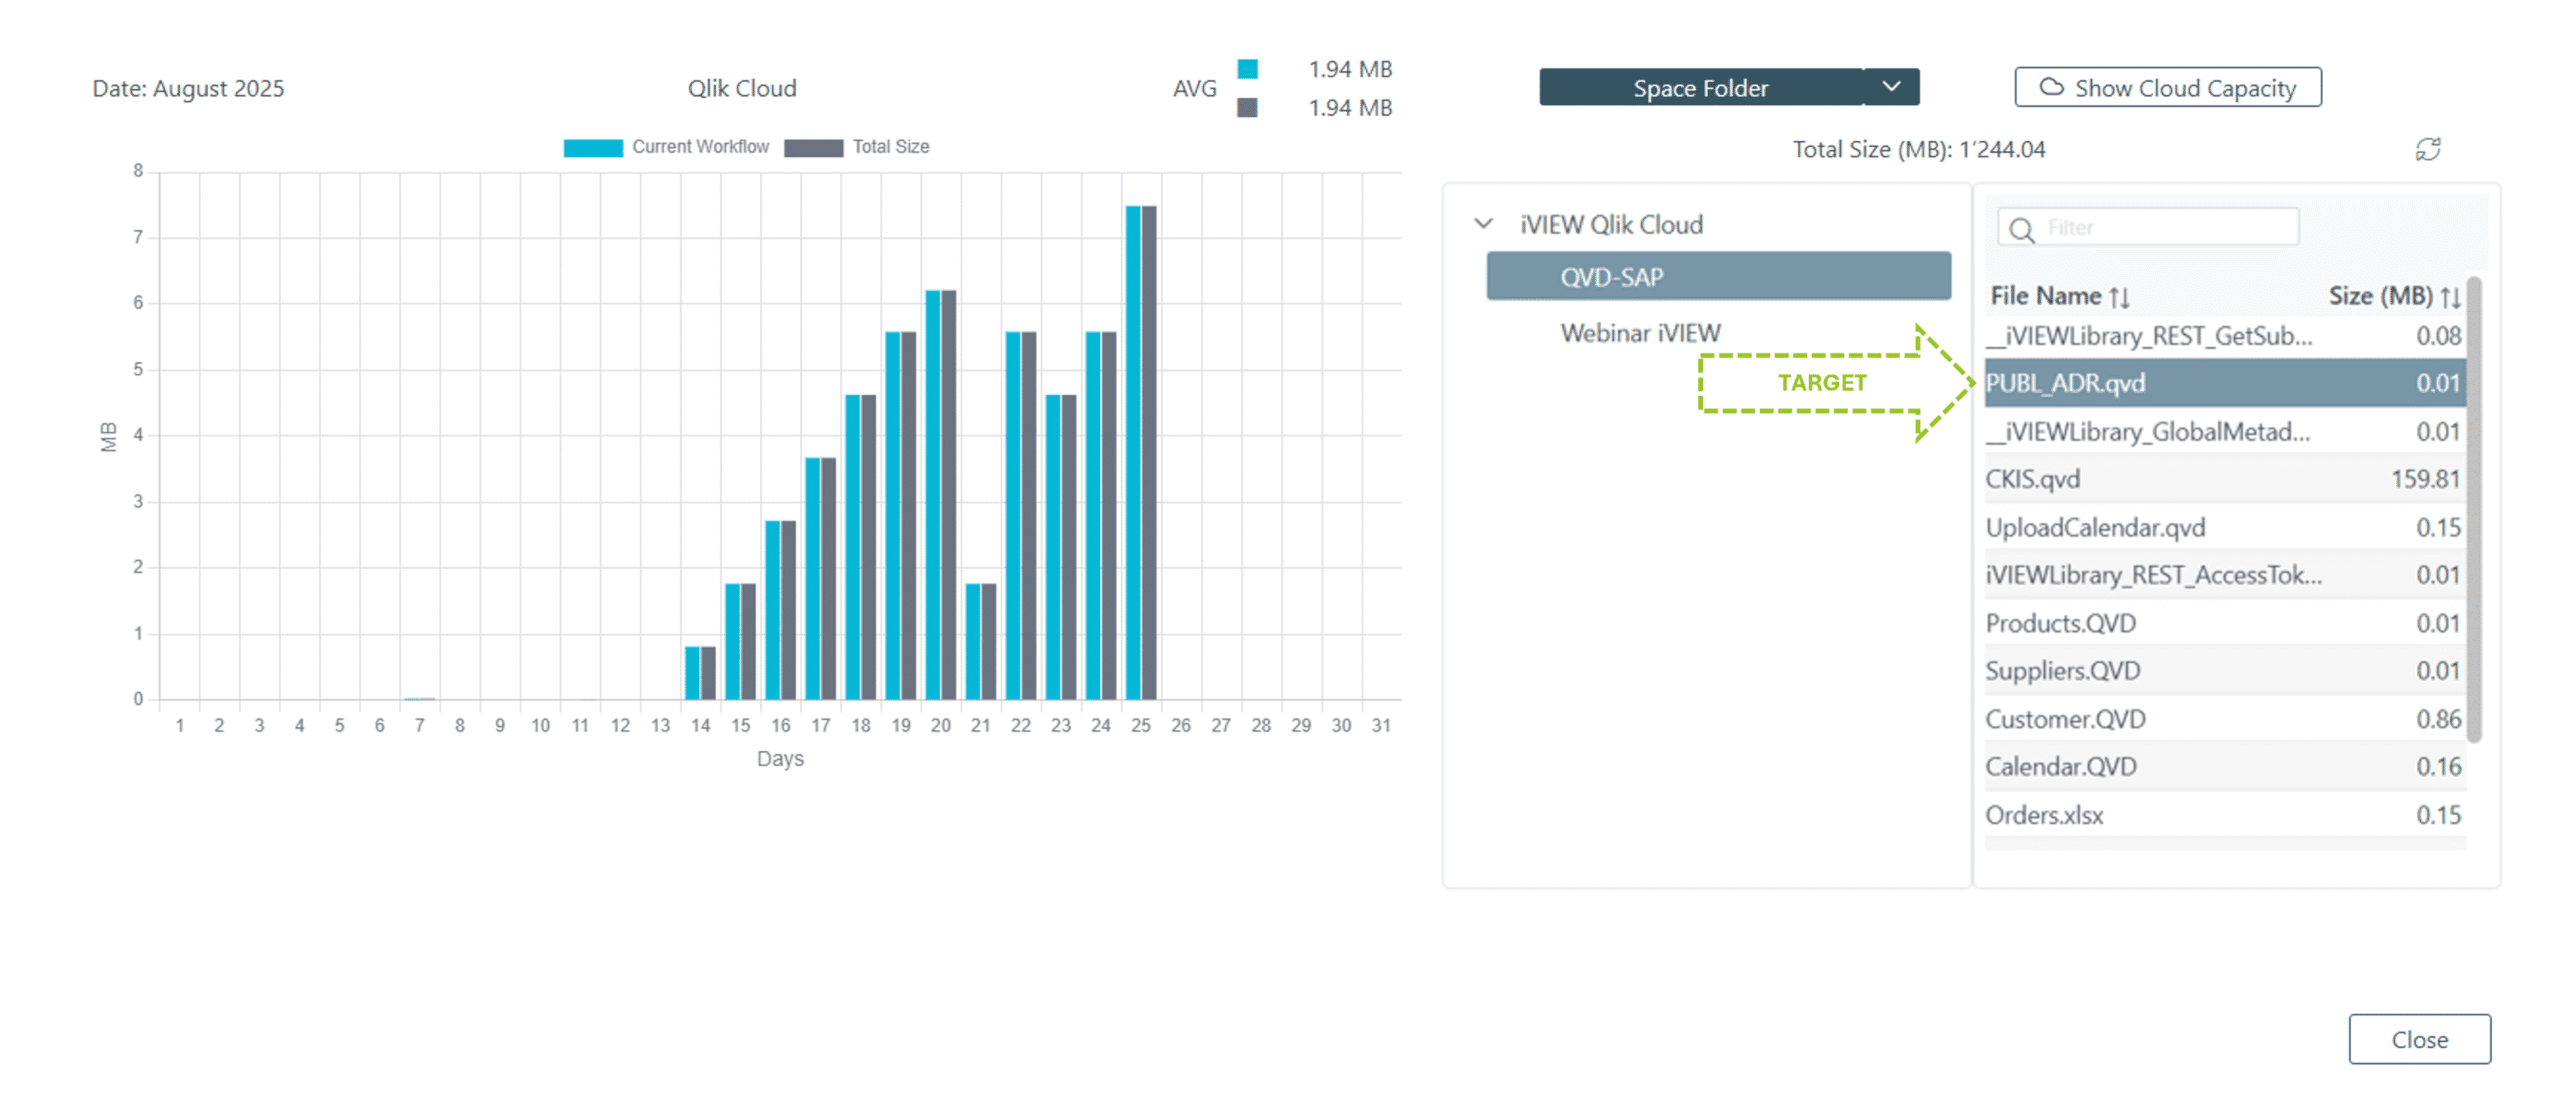
Dataflow gives you a clear overview of every step in the upload process, making your data journey fully transparent and documented.